2ndgradeworksheets.net-Free worksheets and printables for teachers
Common Core State Standard 2.MD.10
Measurement & Data
Represent and interpret data.
Draw a picture graph and a bar graph (with single-unit scale) to represent a data set with up to four categories. Solve simple put-together, take-apart, and compare problems 1 using information presented in a bar graph.
Common Core State Standards: 2.MD.10
 Chinese
New Year Bar Graph
Chinese
New Year Bar Graph
Common Core State Standards:
2.MD.10 Represent and Interpret Data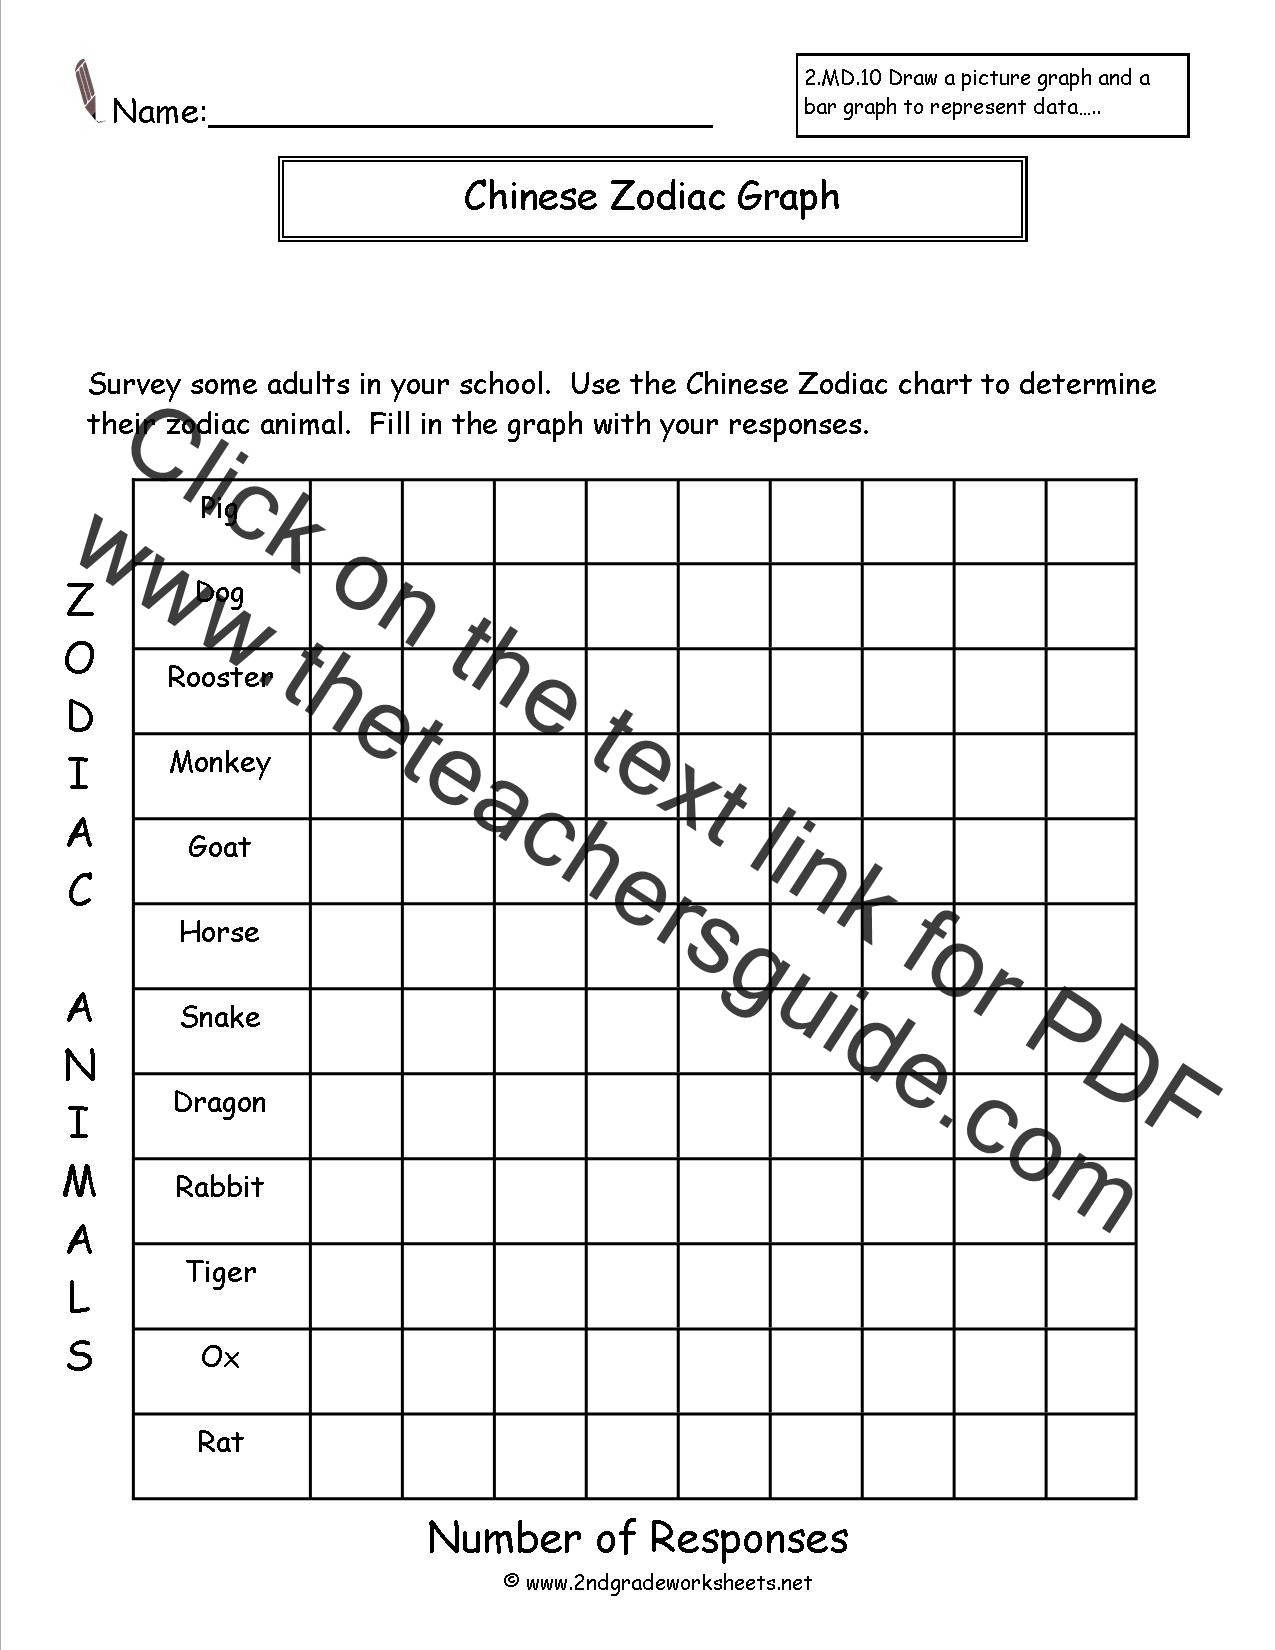
Students take a survey of birth dates and determine zodiac animal. Results are tallied and used to create a bar graph and pictograph. Includes questions. 4 pages.
 Favorite
Girl Scout Cookies Bar Graph
Favorite
Girl Scout Cookies Bar Graph
Common Core State Standards:
2.MD.10 Represent and Interpret Data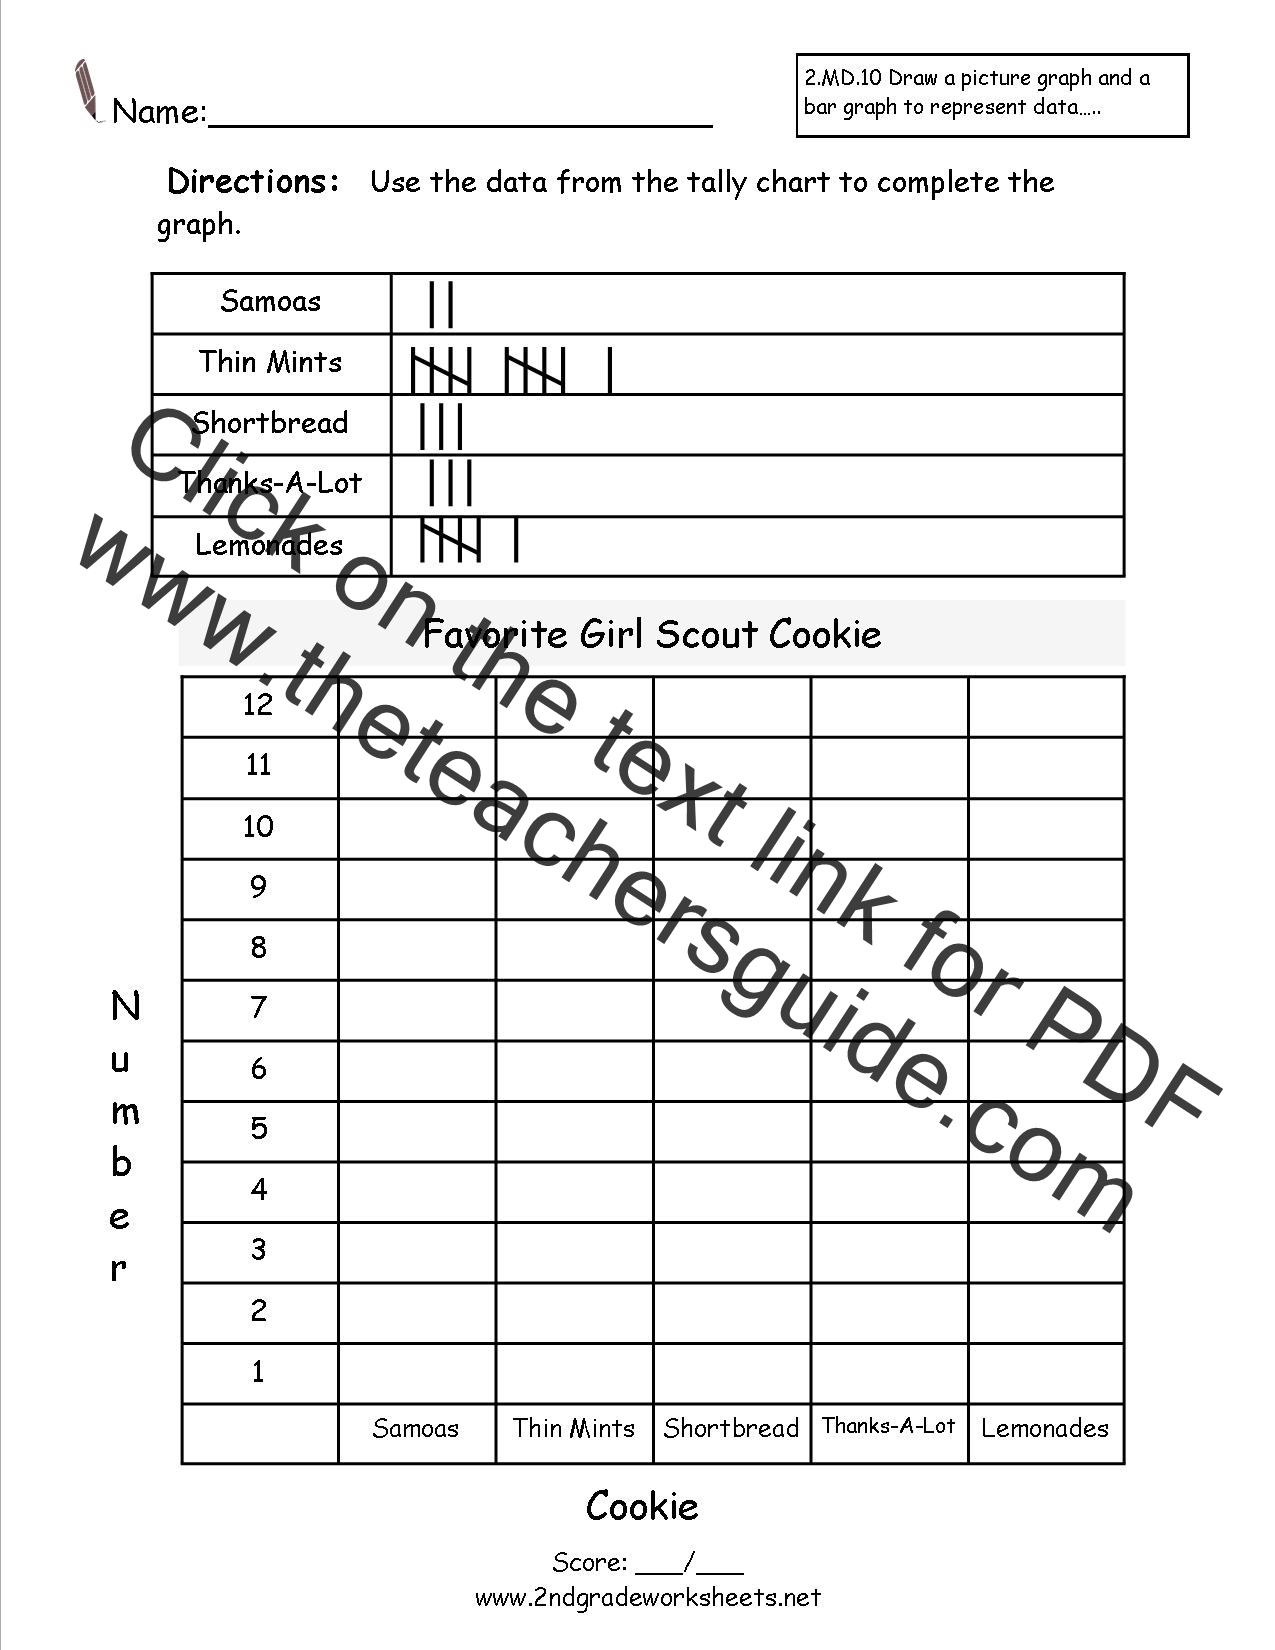
Students can conduct their own survey and create a tally chart or use given completed tally chart to create a bar graph and answer questions. 5 pages.
 Favorite
Day of the Week Bar Graph
Favorite
Day of the Week Bar Graph
Common Core State Standards:
2.MD.10 Represent and Interpret Data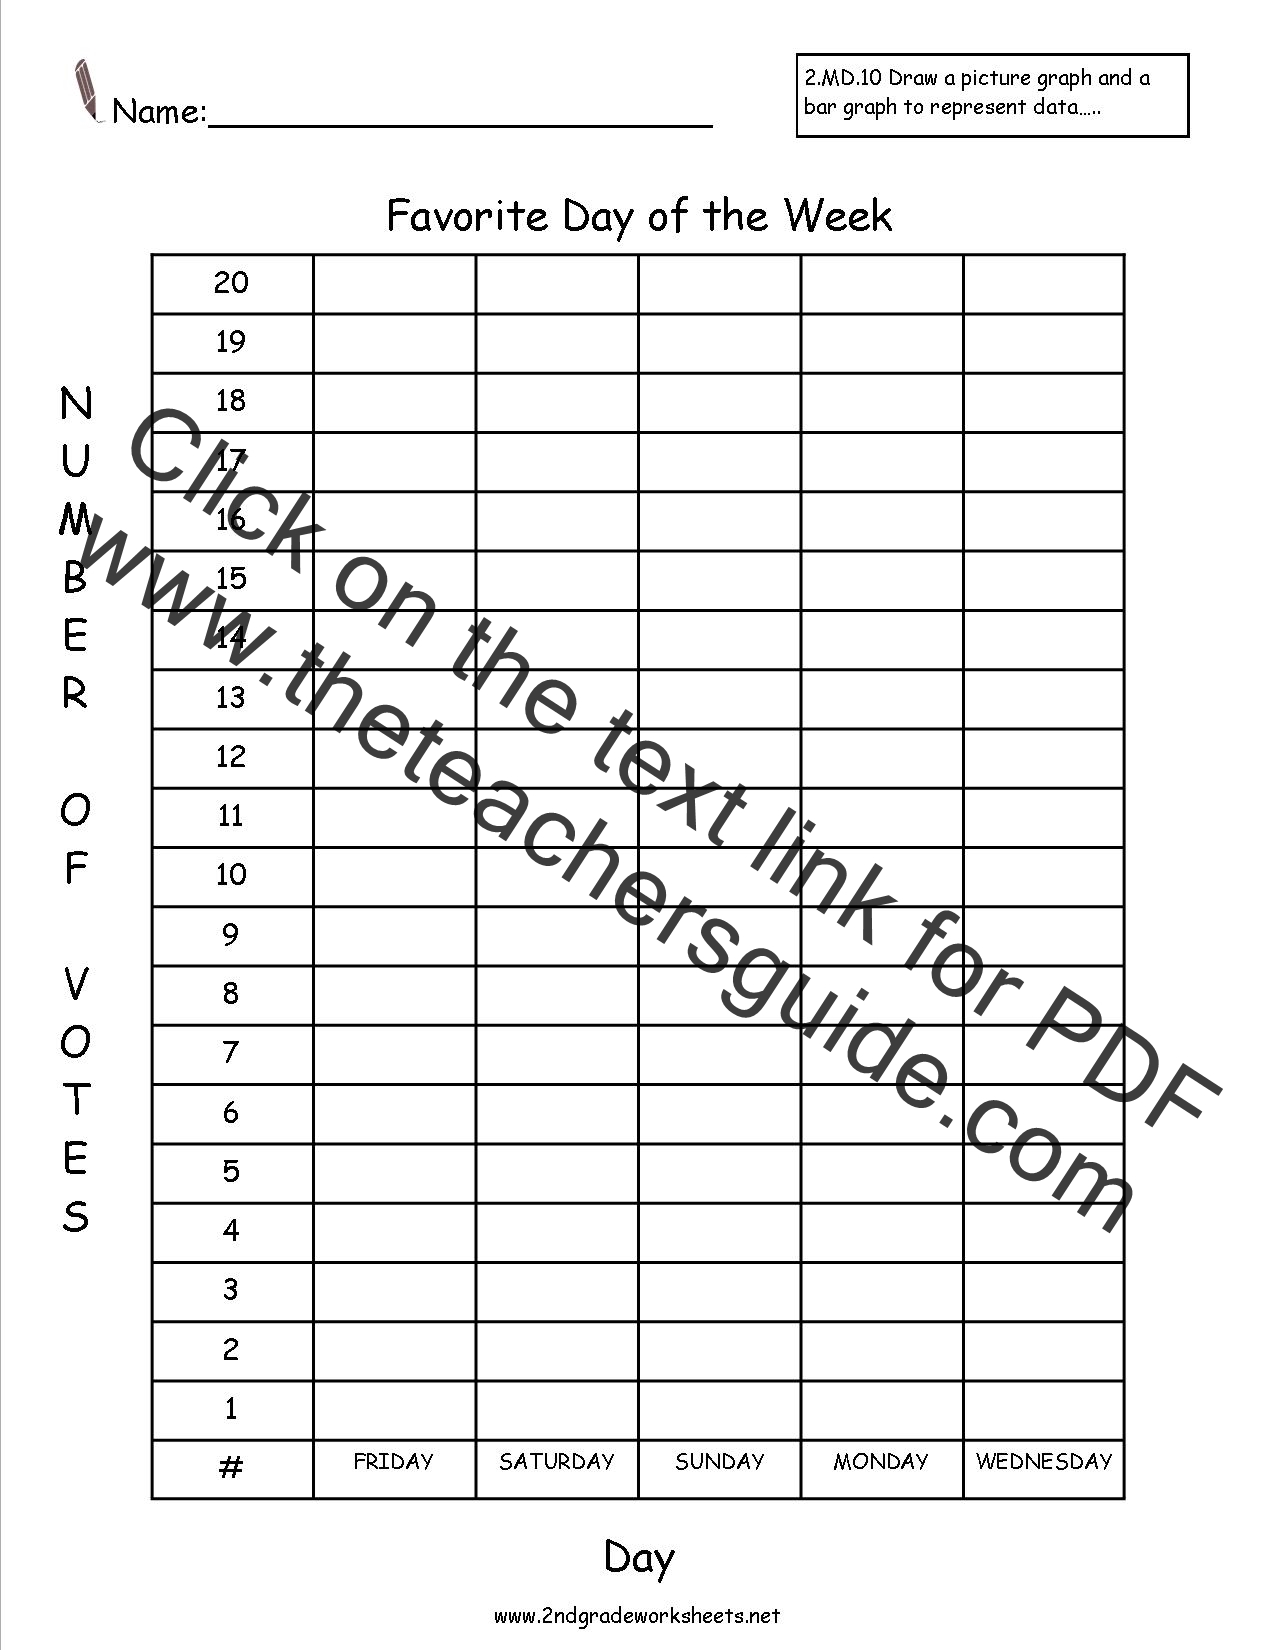
Survey the class and create a bar graph. 6 pages.
 Favorite
Fruit Bar Graph
Favorite
Fruit Bar Graph
Common Core State Standards:
2.MD.10 Represent and Interpret Data
Survey the class and create a bar graph and pictograph. 6 pages.
 Favorite
Holiday Bar Graph
Favorite
Holiday Bar Graph
Common Core State Standards:
2.MD.10 Represent and Interpret Data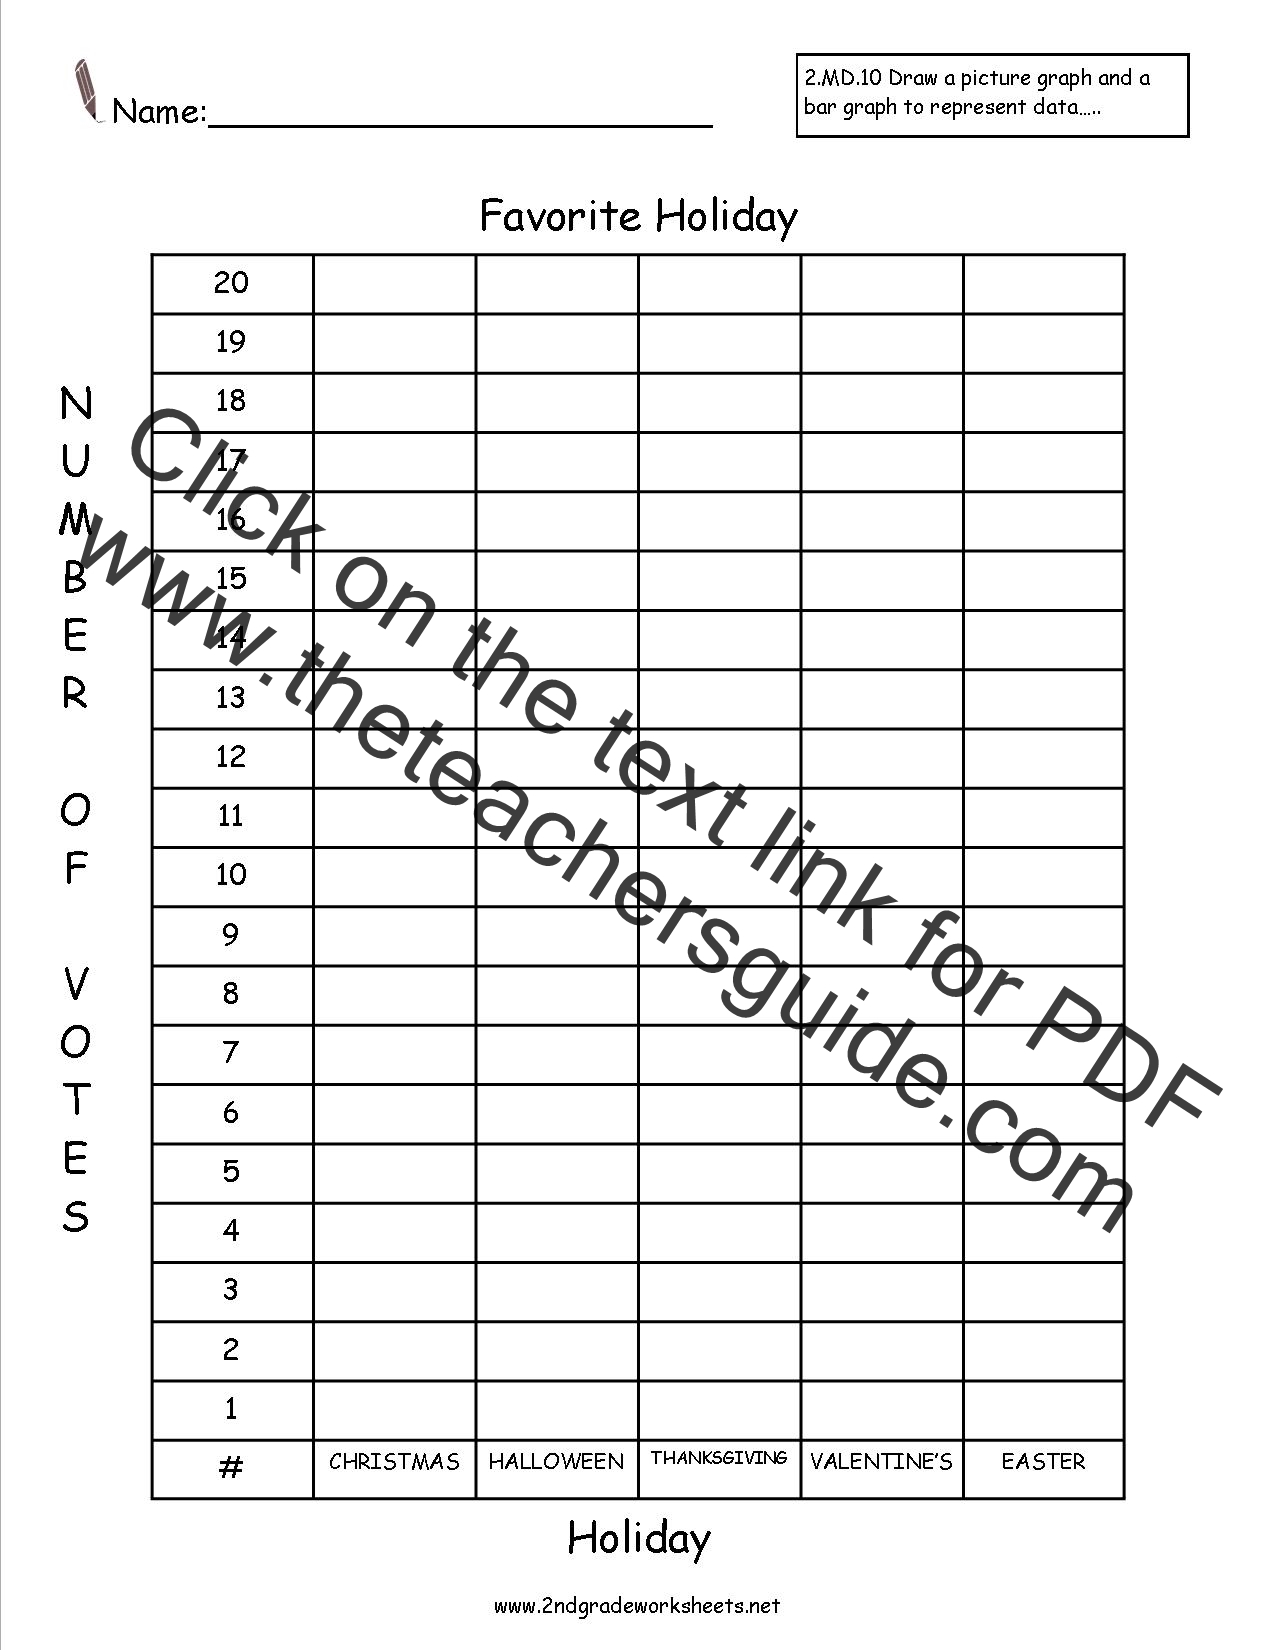
Survey the class and create a bar graph and pictograph. 6 pages.
 Favorite
Pet Bar Graph
Favorite
Pet Bar Graph
Common Core State Standards:
2.MD.10 Represent and Interpret Data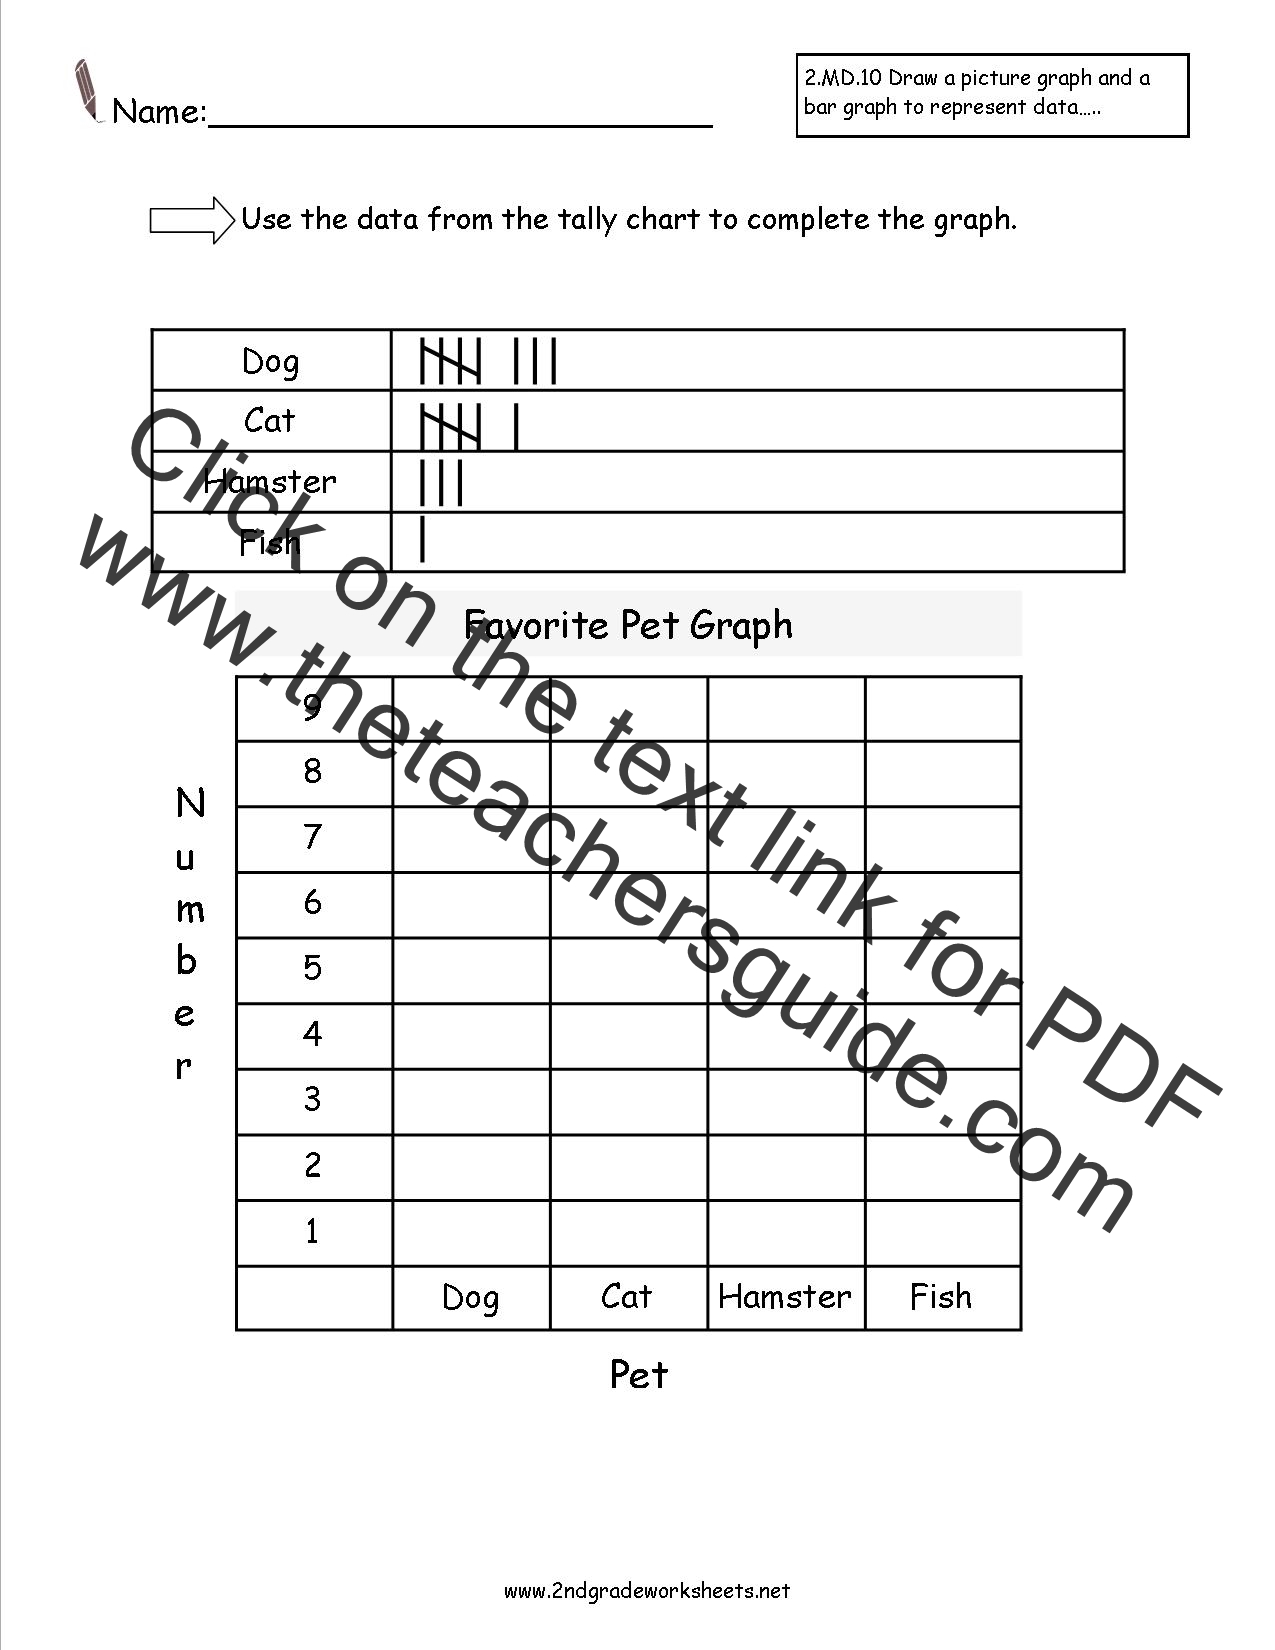
Survey the class and create a bar graph and pictograph. 6 pages.
 Favorite
Season Bar Graph
Favorite
Season Bar Graph
Common Core State Standards:
2.MD.10 Represent and Interpret Data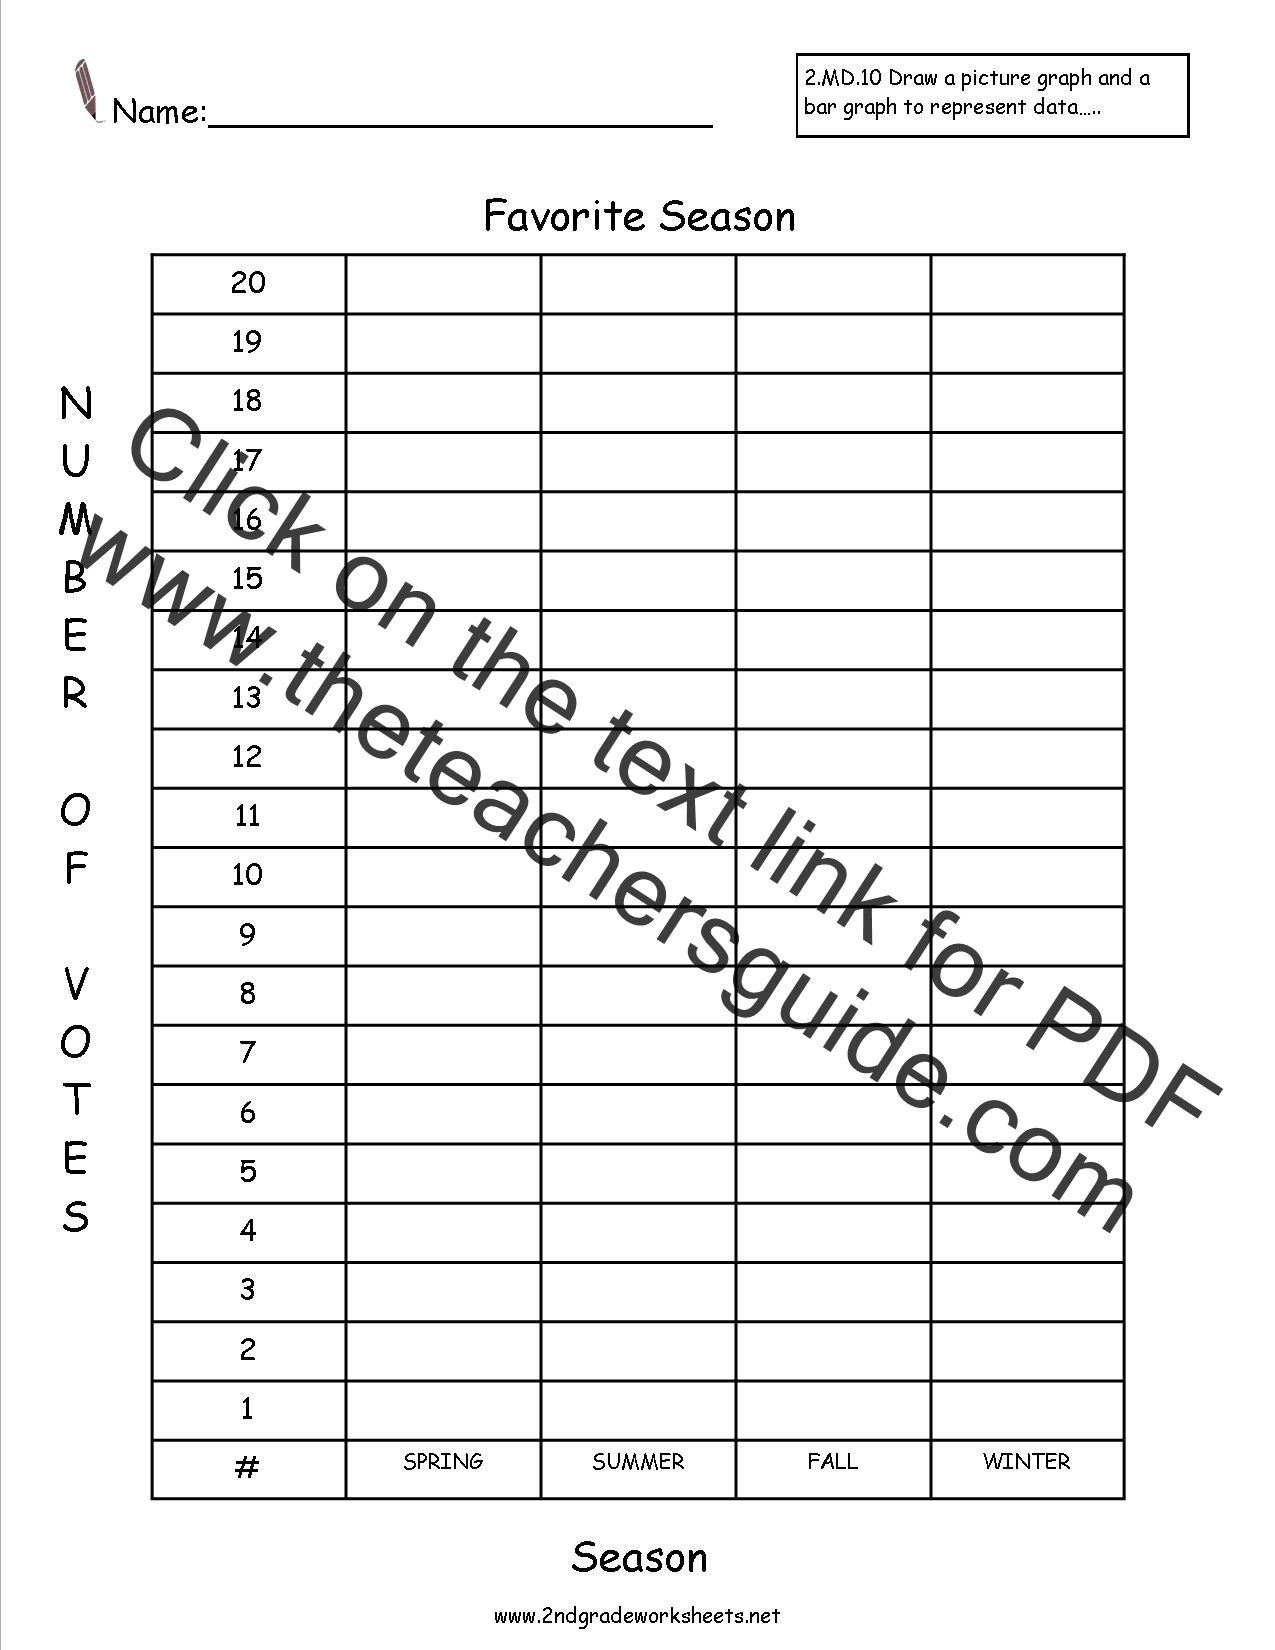
Survey the class and create a bar graph and pictograph. 6 pages.
 Favorite
Sport Bar Graph
Favorite
Sport Bar Graph
Common Core State Standards:
2.MD.10 Represent and Interpret Data
Survey the class and create a bar graph and pictograph. 6 pages.
Favorite
Pet Bar Graph
Common Core State Standards:
2.MD.10 Represent and Interpret DataUse the completed tally chart to create a bar graph and pictograph. 3 pages.
 Favorite
Pizza Bar Graph
Favorite
Pizza Bar Graph
Common Core State Standards:
2.MD.10 Represent and Interpret Data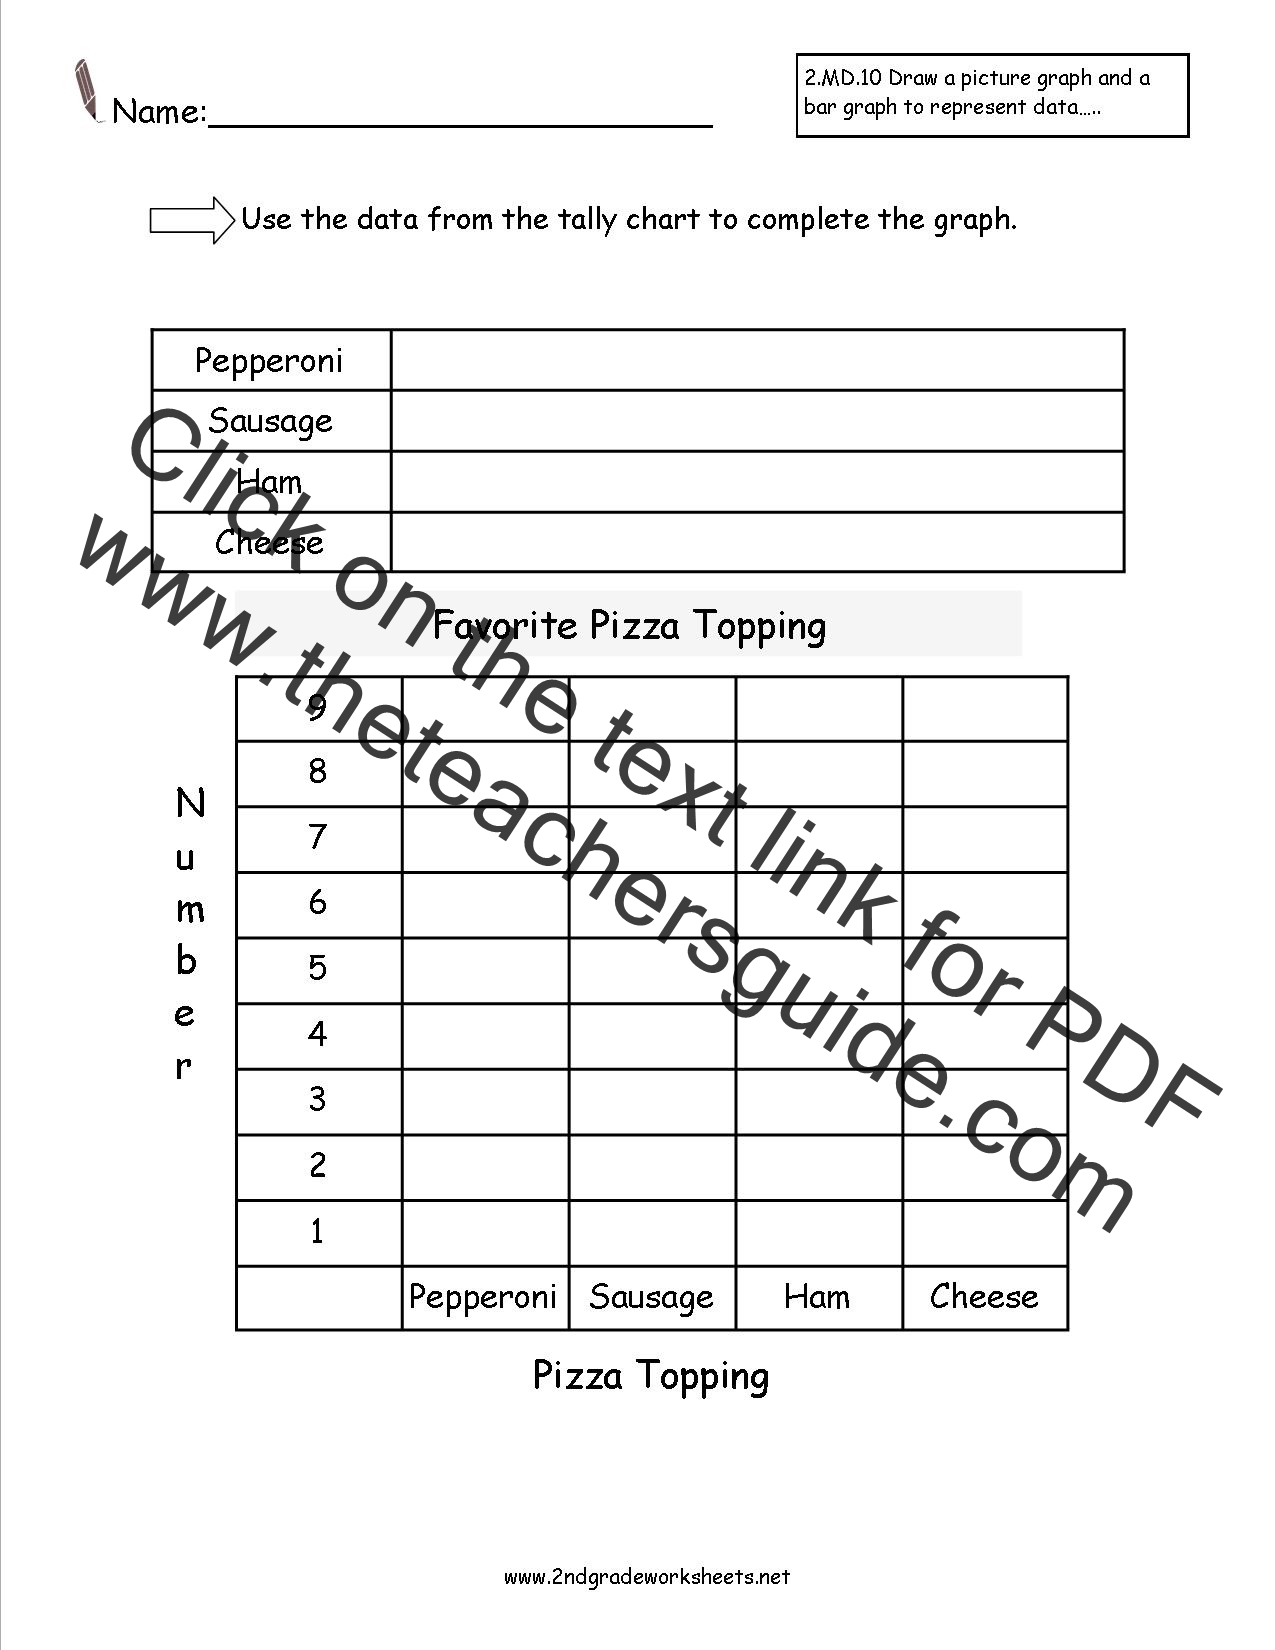
Survey the class or use a completed tally chart to create a bar graph and pictograph. 3 pages.
 Favorite
Season Bar Graph
Favorite
Season Bar Graph
Common Core State Standards:
2.MD.10 Represent and Interpret Data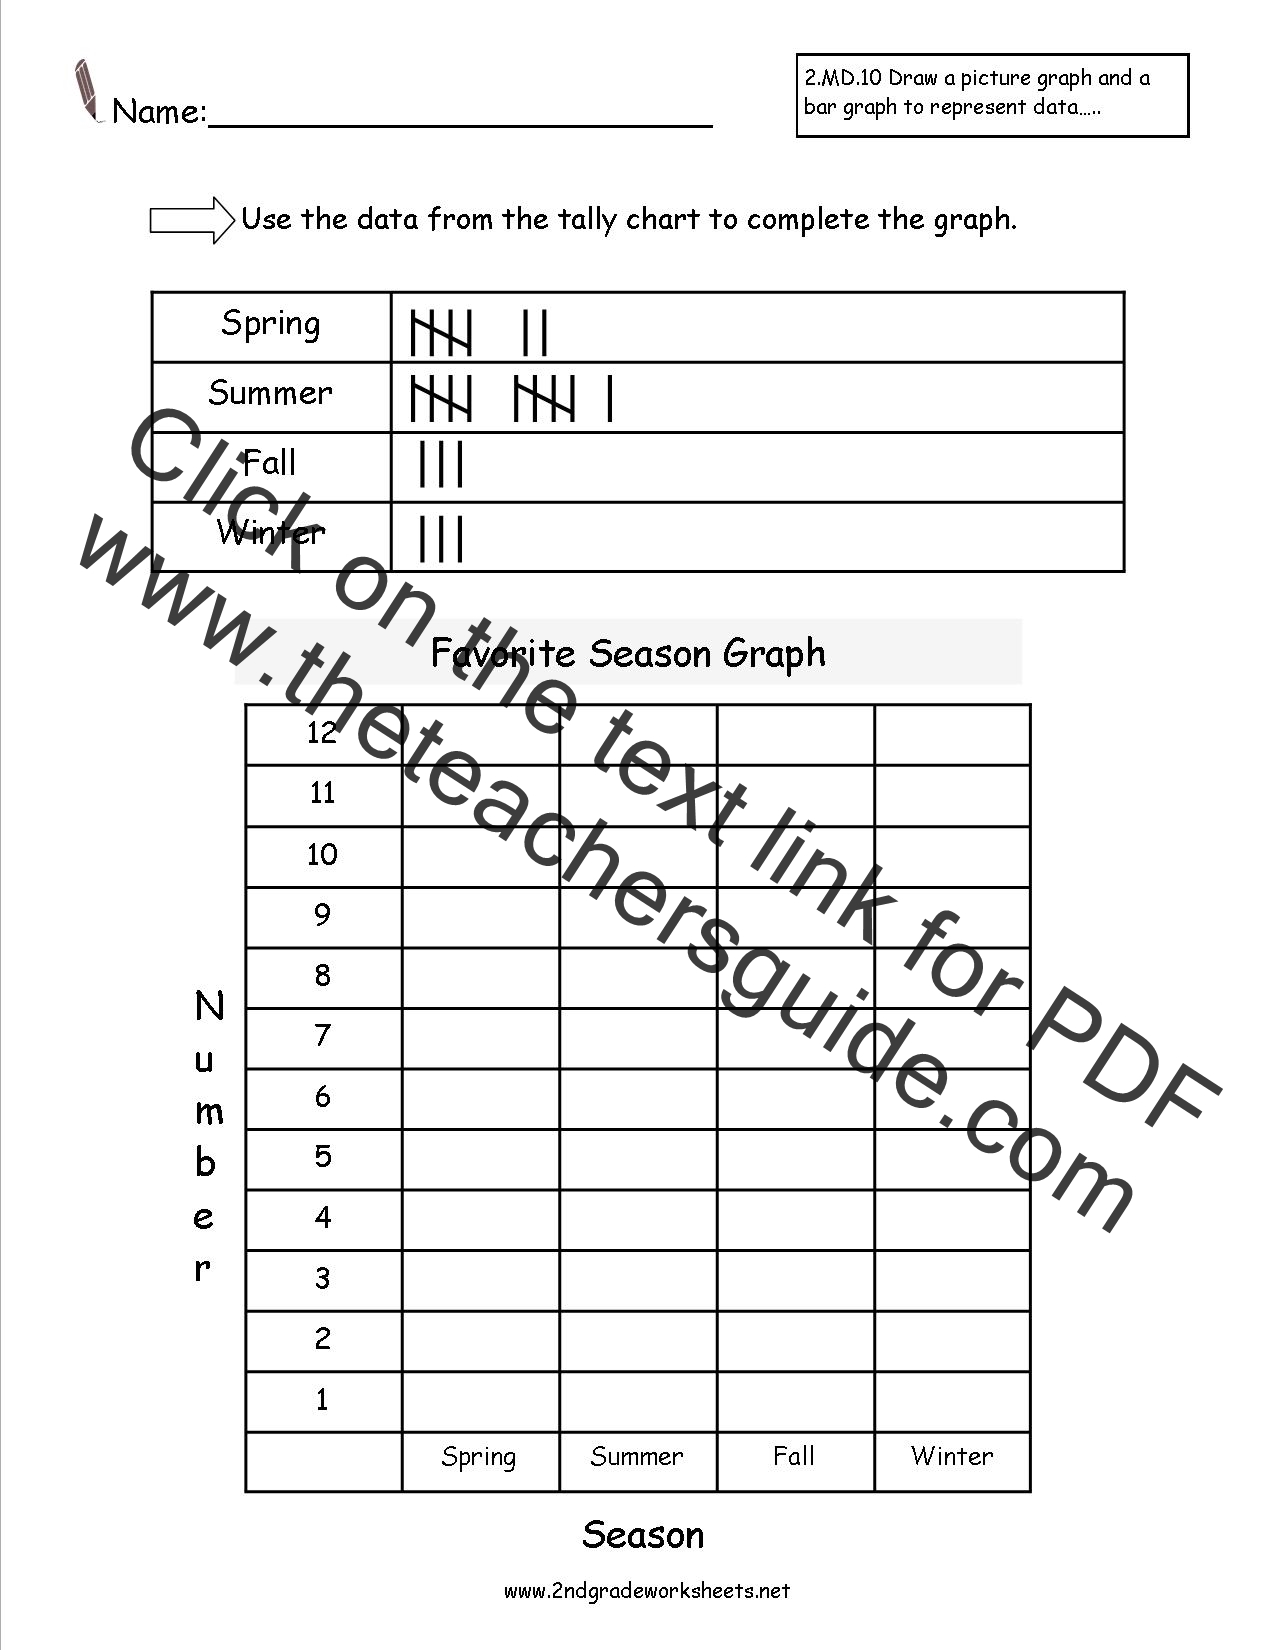
Use the completed tally chart to complete a bar graph. 3 pages.
 Favorite
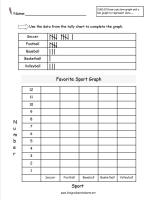
Sport Bar Graph
Favorite
Sport Bar Graph
Common Core State Standards:
2.MD.10 Represent and Interpret Data
Use the completed tally chart to complete a bar graph. 3 pages.
 Favorite
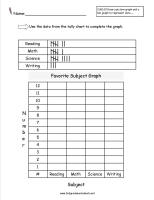
Subject Bar Graph
Favorite
Subject Bar Graph
Common Core State Standards:
2.MD.10 Represent and Interpret Data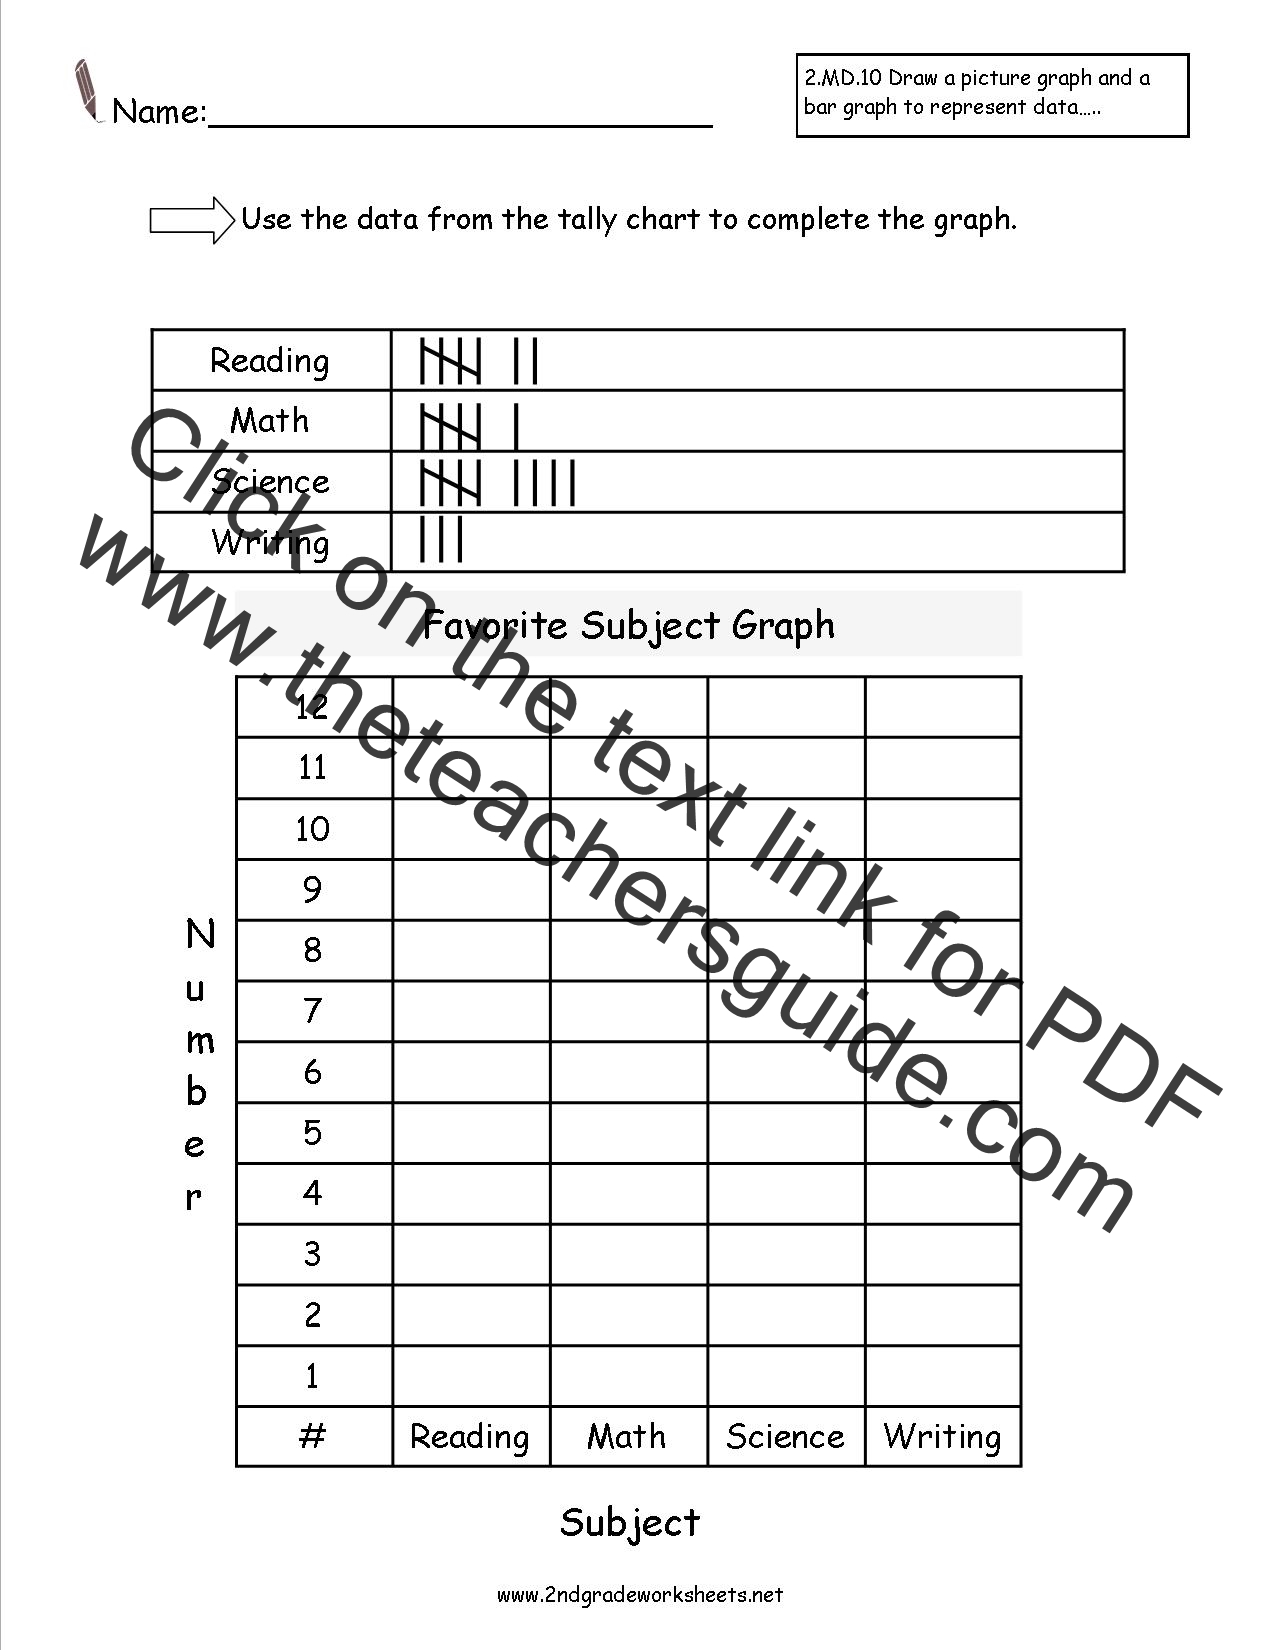
Use the completed tally chart to complete a bar graph. 3 pages.
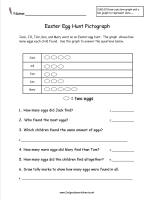 Easter
Egg Hunt Pictograph
Easter
Egg Hunt Pictograph
Common Core State Standards:
2.MD.10 Represent and Interpret Data
Students read the completed pictograph to answer questions.
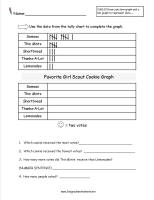 Favorite
Girl Scout Cookies Pictograph
Favorite
Girl Scout Cookies Pictograph
Common Core State Standards:
2.MD.10 Represent and Interpret Data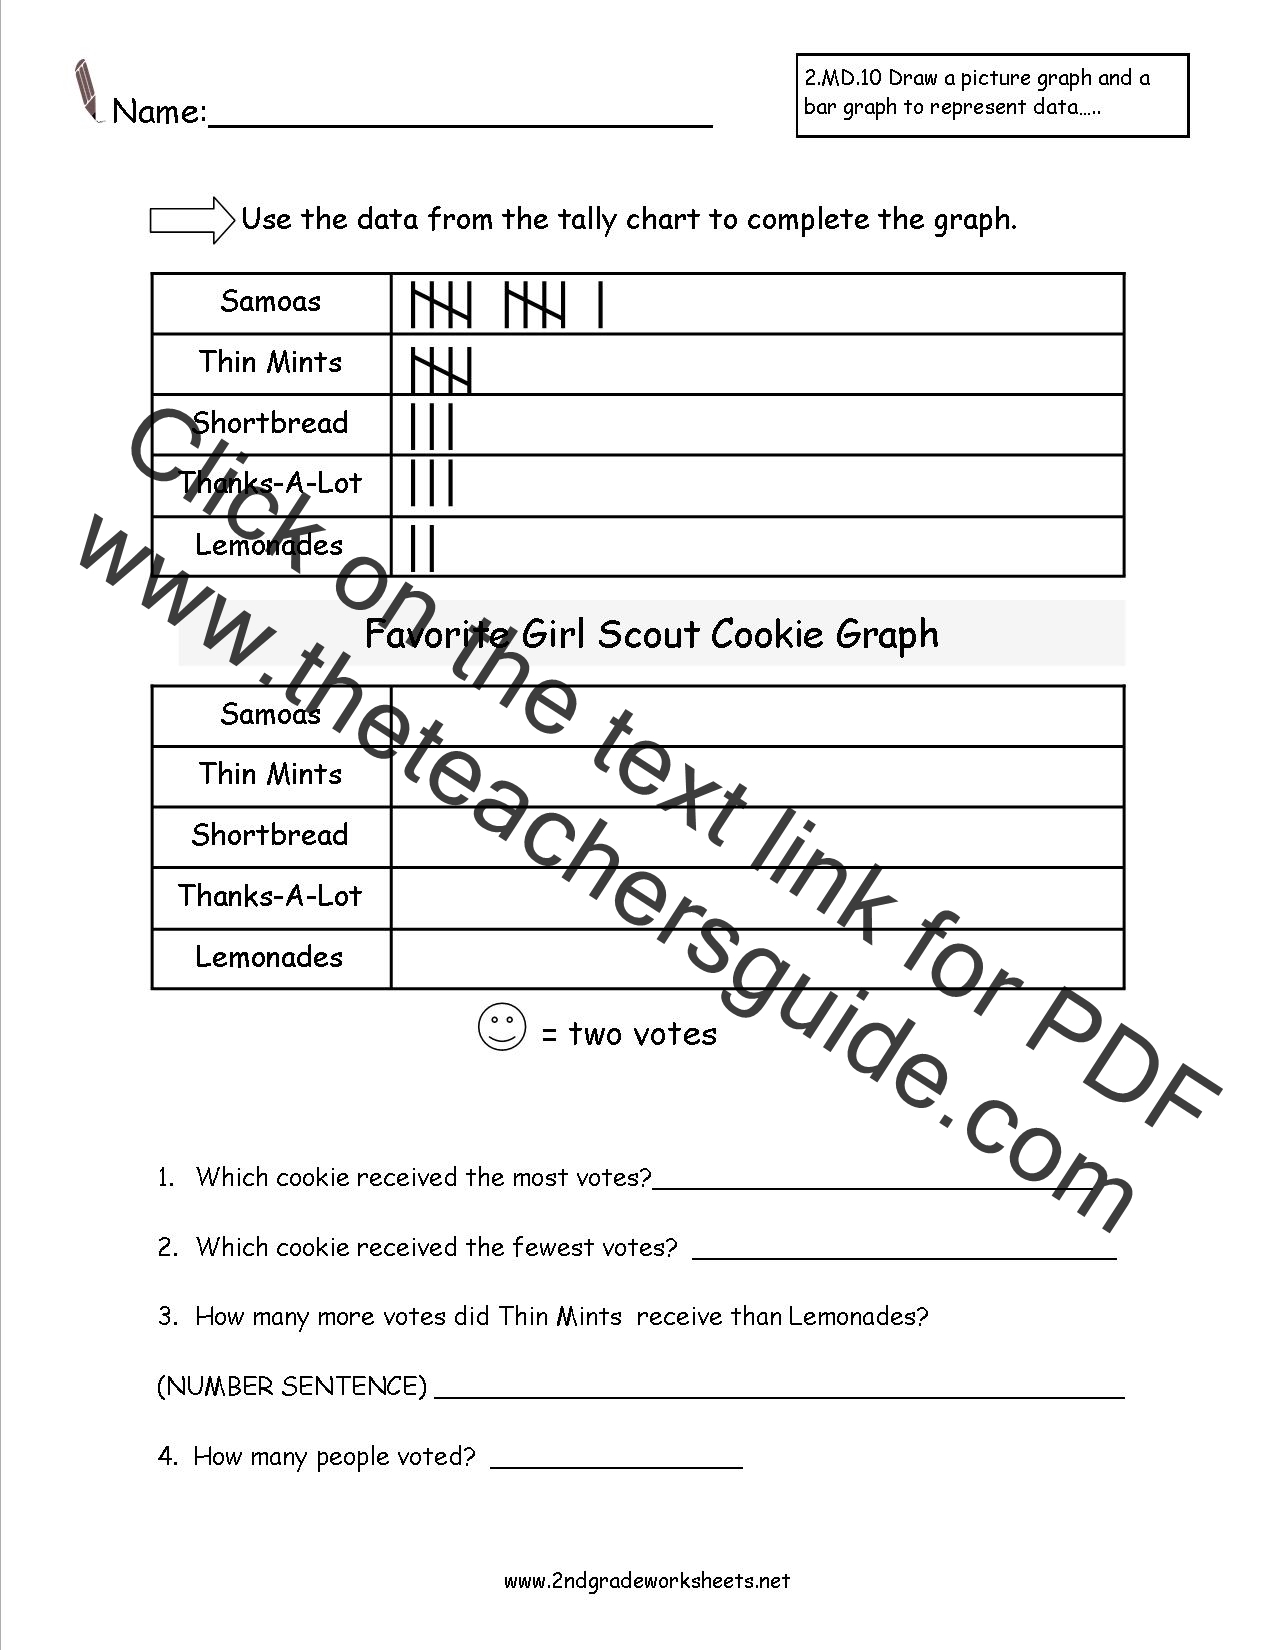
Students use completed tally chart to create a pictograph and answer questions.
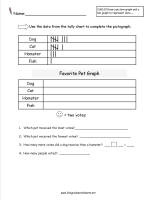 Favorite
Pet Pictograph
Favorite
Pet Pictograph
Common Core State Standards:
2.MD.10 Represent and Interpret Data
Students use completed tally chart to create a pictograph and answer questions.
 Favorite
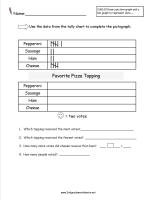
Pizza Topping Pictograph
Favorite
Pizza Topping Pictograph
Common Core State Standards:
2.MD.10 Represent and Interpret Data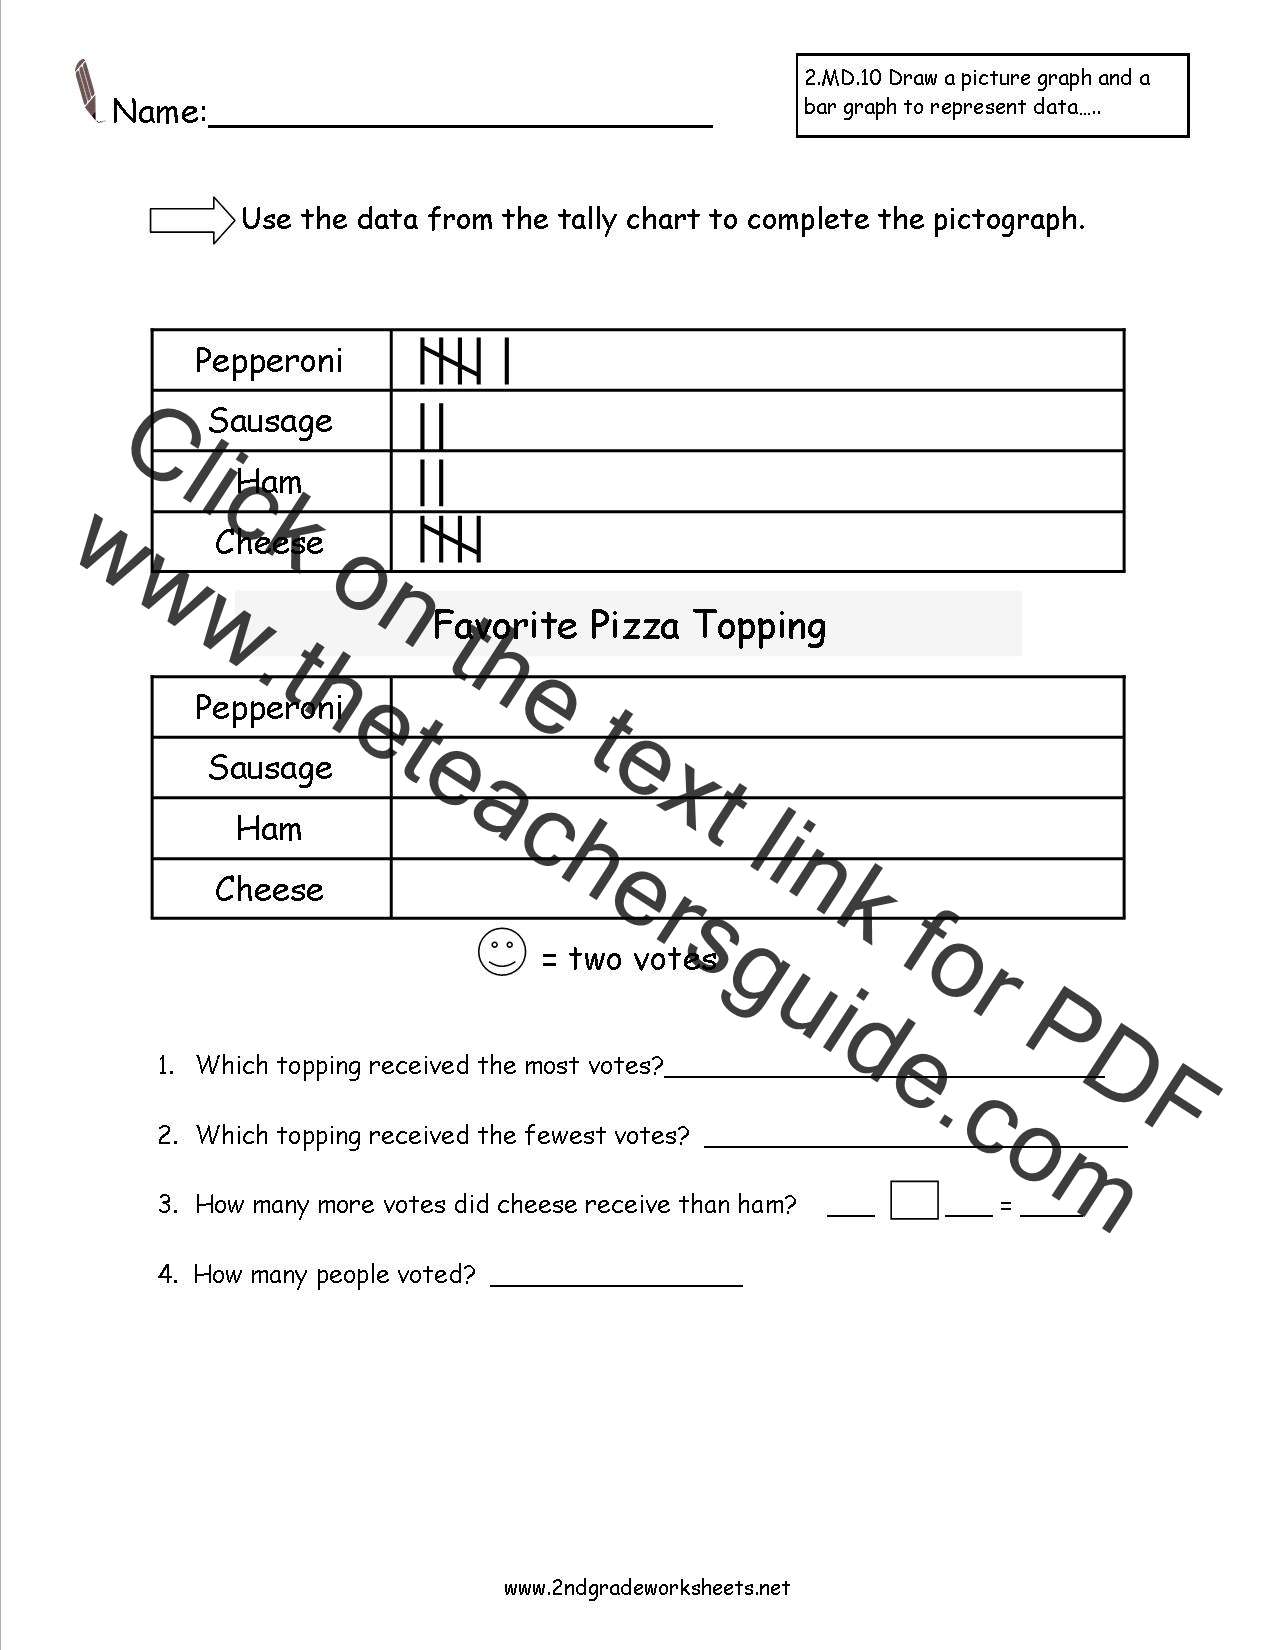
Students use completed tally chart to create a pictograph and answer questions.
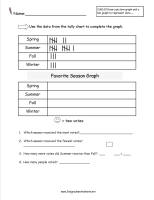 Favorite
Season Pictograph
Favorite
Season Pictograph
Common Core State Standards:
2.MD.10 Represent and Interpret Data
Students use completed tally chart to create a pictograph and answer questions.
 Favorite
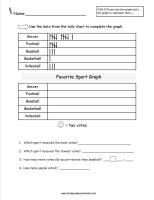
Sport Pictograph
Favorite
Sport Pictograph
Common Core State Standards:
2.MD.10 Represent and Interpret Data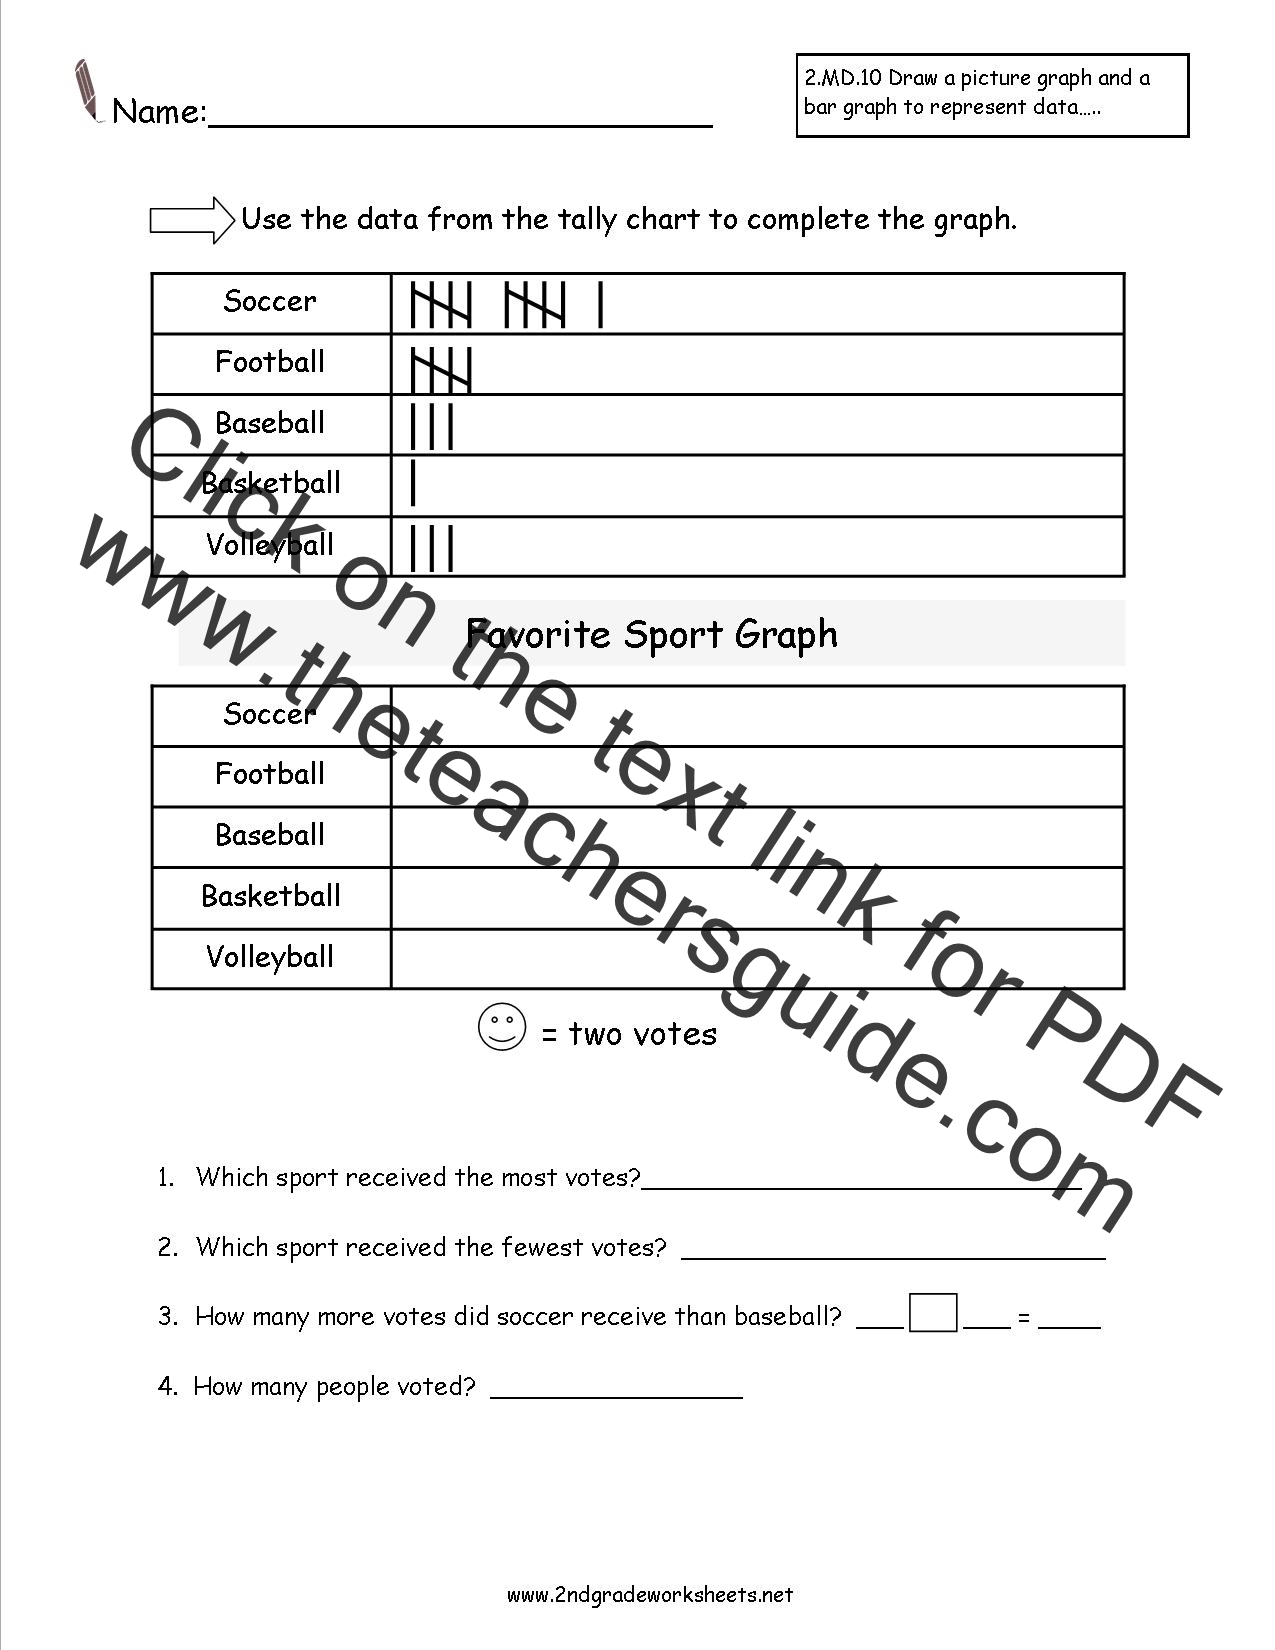
Students use completed tally chart to create a pictograph and answer questions.
 Favorite
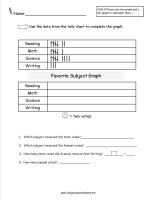
Subject Pictograph
Favorite
Subject Pictograph
Common Core State Standards:
2.MD.10 Represent and Interpret Data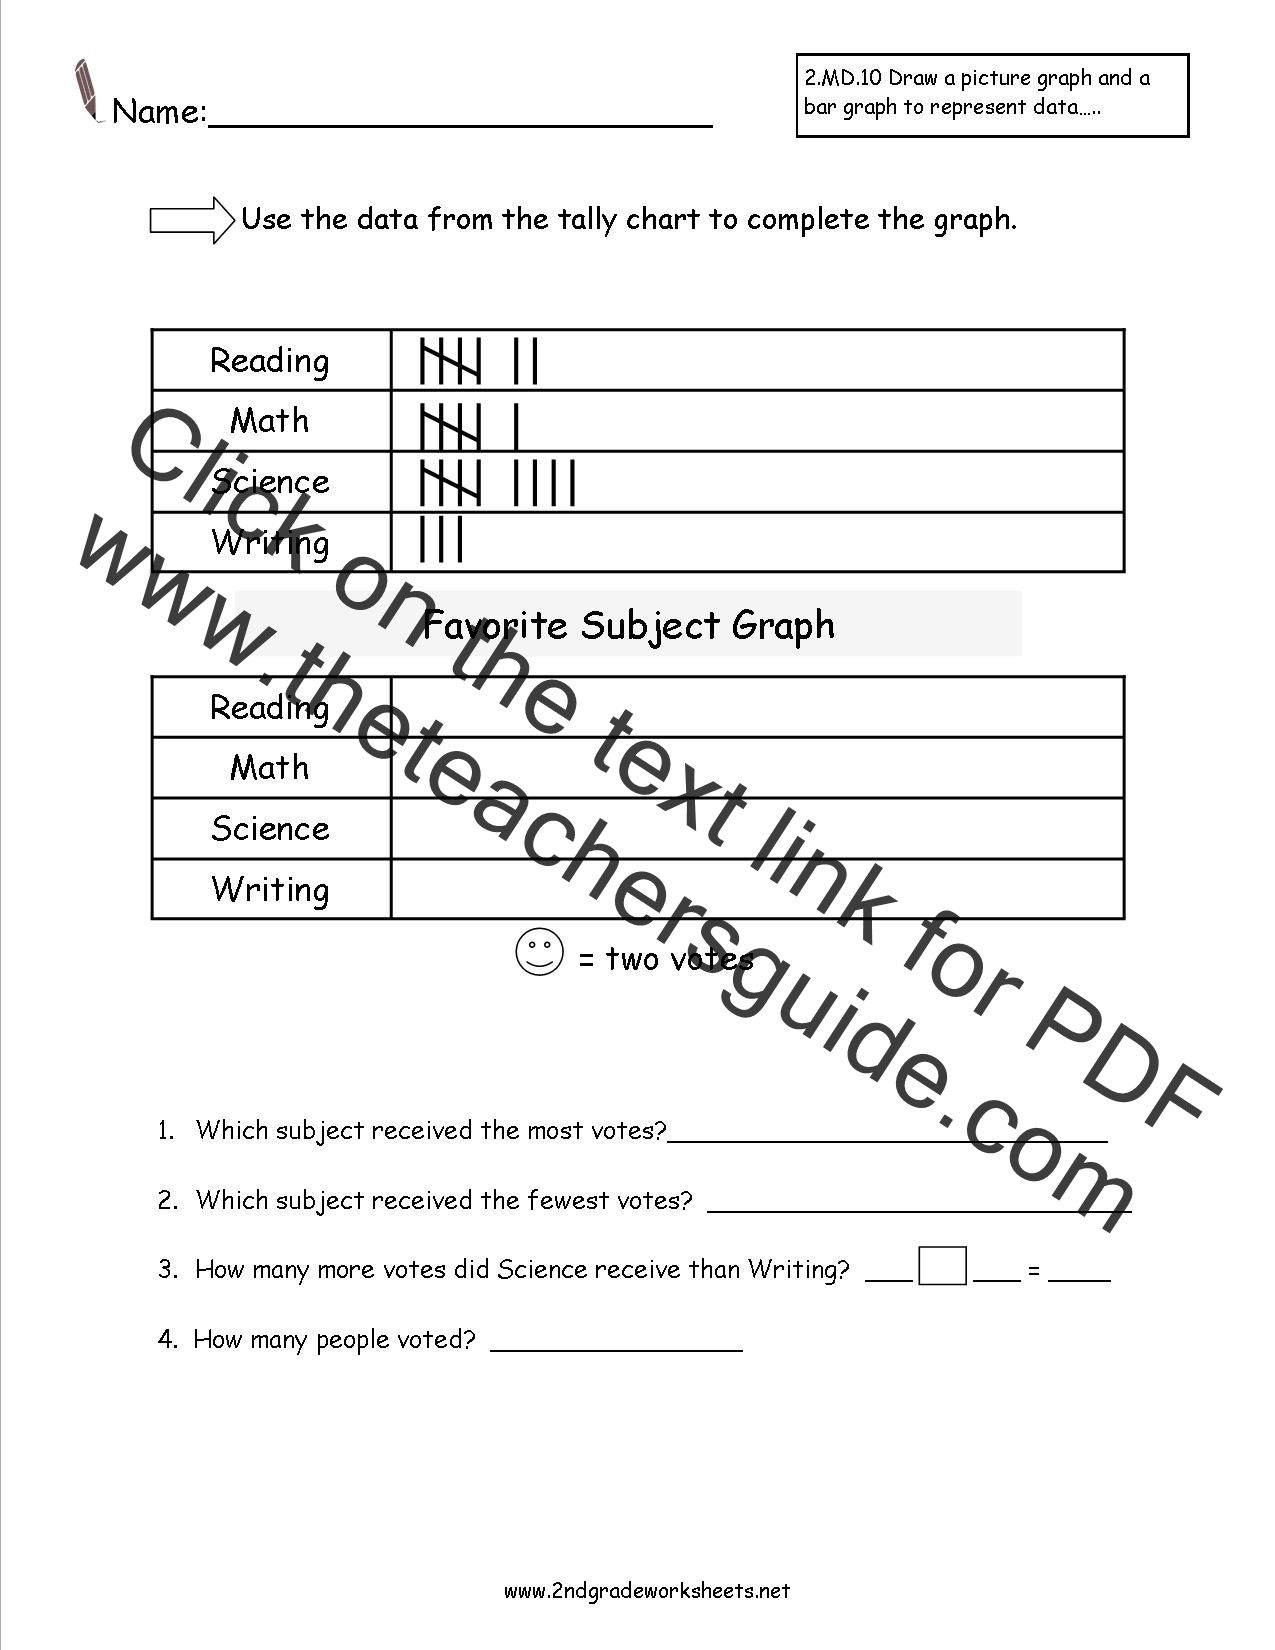
Students use completed tally chart to create a pictograph and answer questions
 Shooting
Stars Pictograph
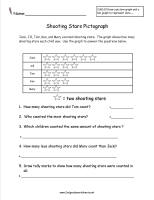
Shooting
Stars Pictograph
Common Core State Standards:
2.MD.10 Represent and Interpret Data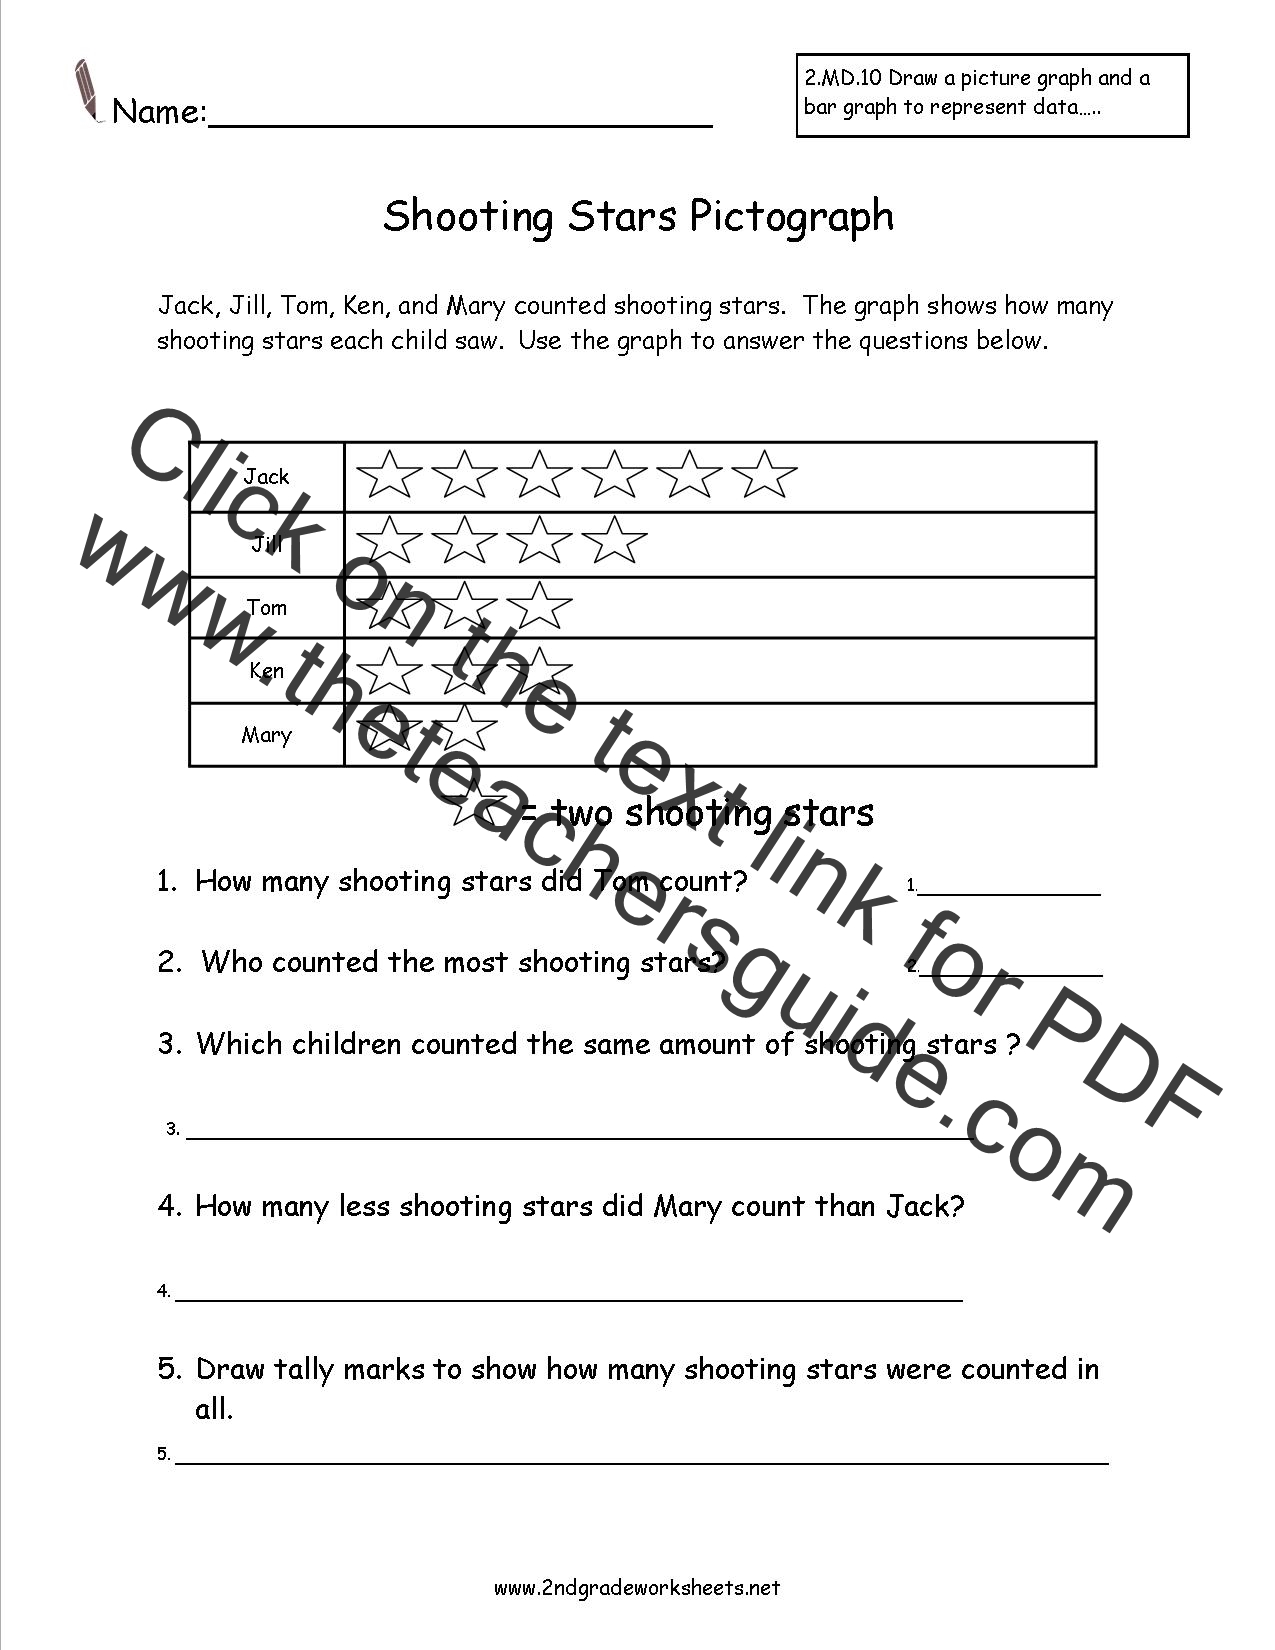
Students read the completed pictograph to answer questions.